

Pre-LSST 20260619#
The Pre-LSST survey continues after the Data Preview 2 (DP2) cutoff. Image quality continues to improve, as well as survey speed. Periodic faults within a night are being beaten down and there are significantly fewer interruptions than during the SV commissioning period, although the observatory continues to have occasional periods of downtime due to larger system problems.
Visits prior to January 6, 2026, are based on the DP2 visit list and include 28698 visits in total. Pre-LSST visits post January 6, 2026 include all on-sky science images. These science images are primarily from the FBS operating in LSST-like mode (44928 visits) however there are also 10360 images coming from AOS stability tests, where the Simonyi Survey Telescope acquires images at a fixed altitude/azimuth position in a single filter for a set period of time. These AOS stability images are primarily acquired in i band. The total number of science visits from DP2 plus Pre-LSST up to June 19, 2026, is 83986.
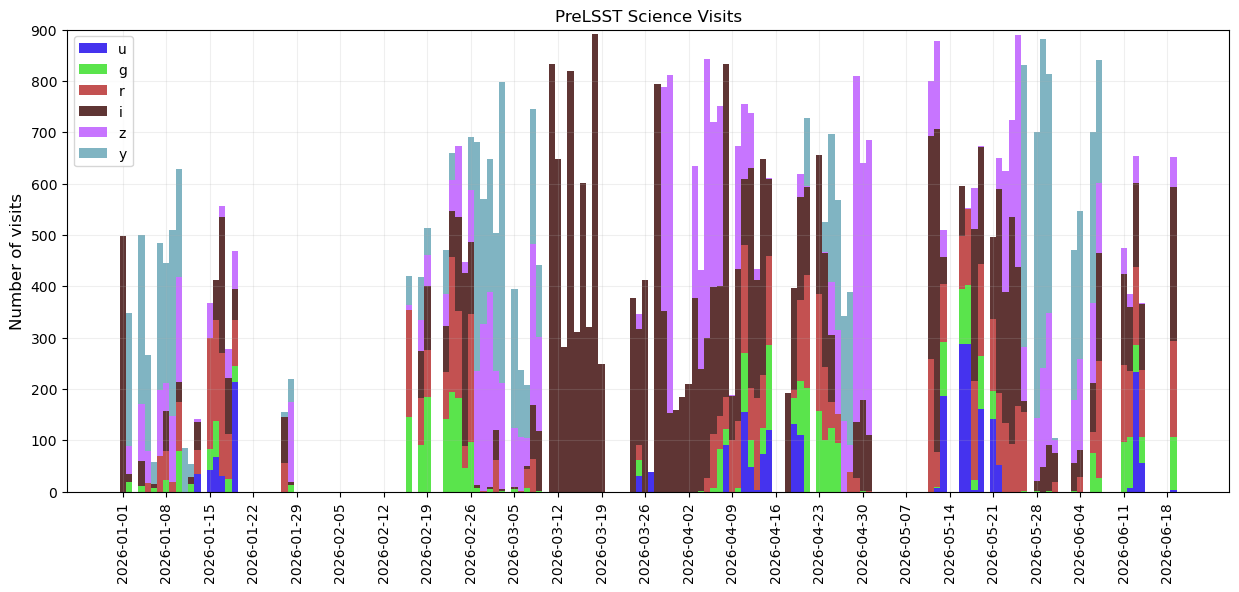
Timeline of science visit acquisition after January 6, 2026.#
The period of extensive i band visits in the middle of March is due to AOS stability test images. During this time period, the FBS continued to operate with a single-visit template tier.
Visit Database#
A pointing database similar to the one released at the end of the SV survey is available for download from prelsst_20260619_visits.db
This database follows the DP2 visit list up to January 6, 2026. After January 6, 2026, all on-sky science visits have been included. Especially for visits not vetted as part of DP2, this database likely includes visits which may may be found not suitable for science.
Coverage#
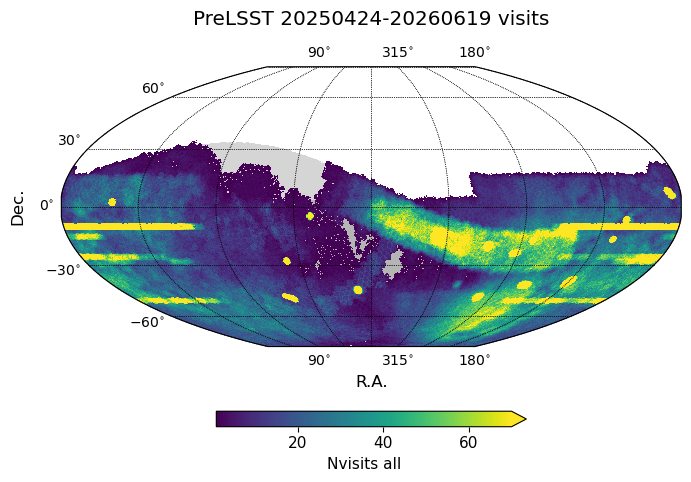
Number of Pre-LSST visits, all bands. The AOS stability tests clearly stand out as stripes at constant declination.#
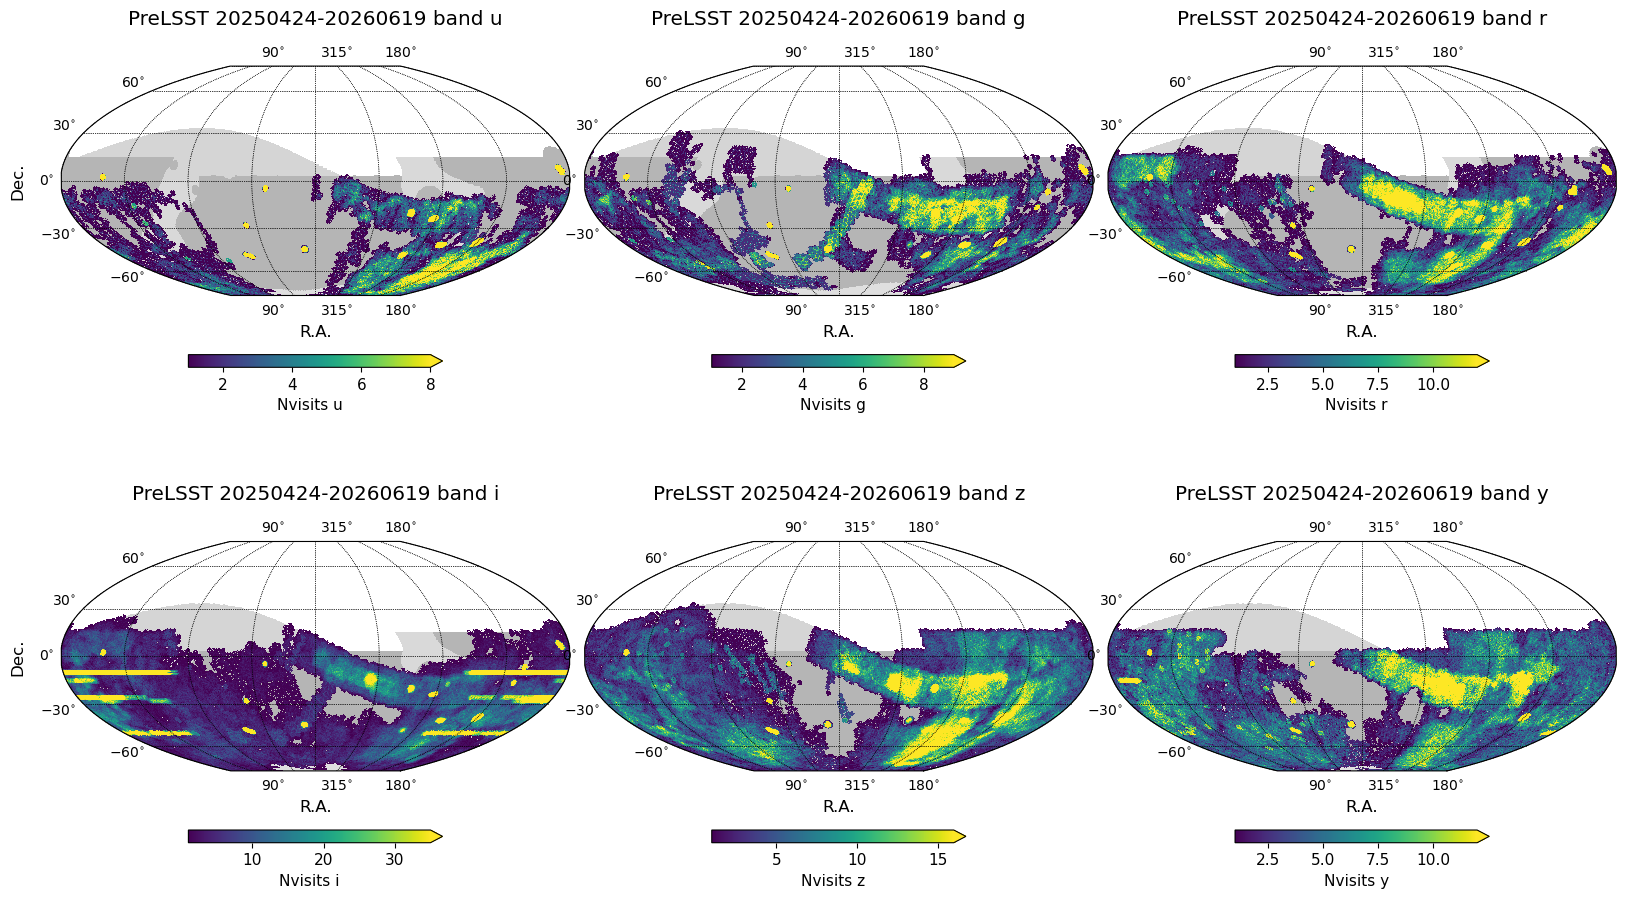
Number of Pre-LSST visits, per band.#
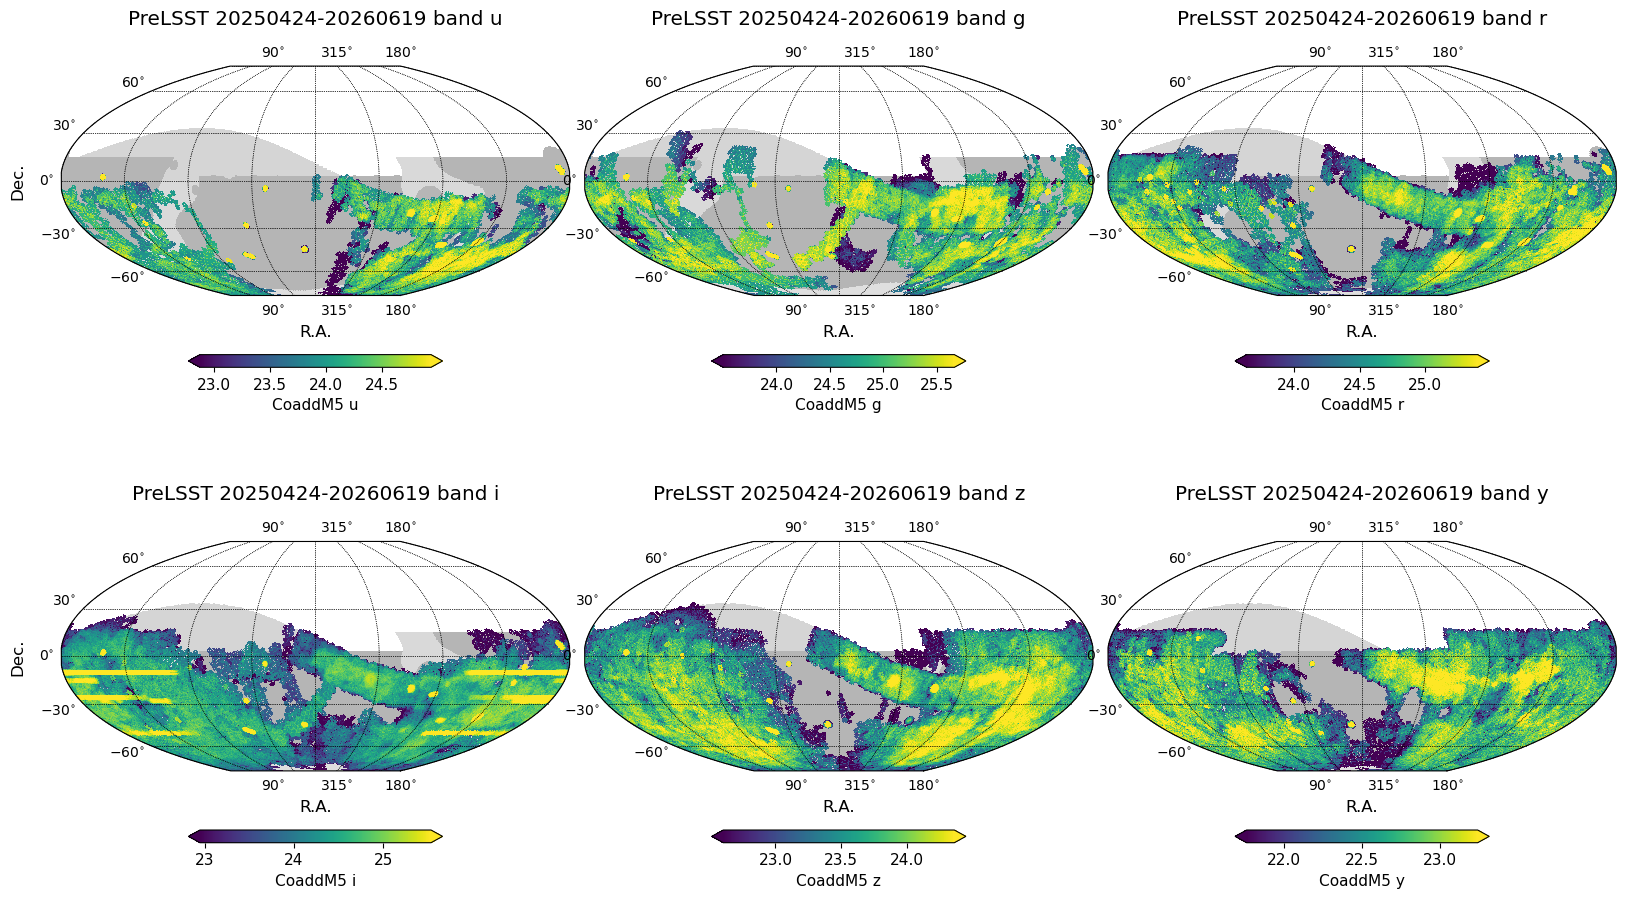
Rough estimate of potential coadded 5-sigma point source limiting magnitude. Not all visits would be included in coadds.#
The median number of visits per point on the sky, for the entire LSST footprint (27188 sq degrees in area) the entire SV original footprint (3k sq degrees), the reduced SV footprint (750 sq degrees) and the central 300 sq degrees of the SV footprint.
Nvisits |
u |
g |
r |
i |
z |
y |
all |
|---|---|---|---|---|---|---|---|
LSST |
0 |
1 |
2 |
4 |
4 |
4 |
18 |
3k |
2 |
5 |
8 |
10 |
9 |
8 |
47 |
750 |
2 |
6 |
13 |
16 |
12 |
12 |
63 |
300 |
2 |
6 |
11 |
18 |
19 |
14 |
72 |
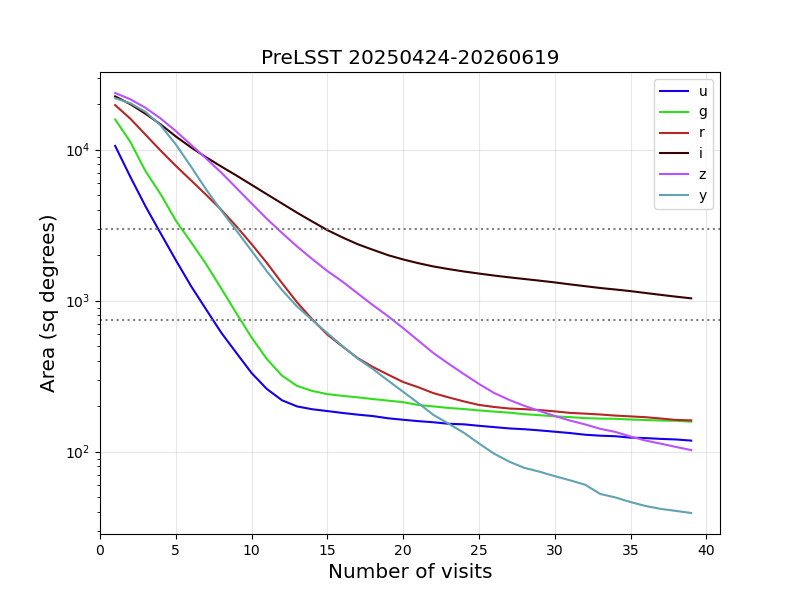
Area covered with at least X visits per band to date.#
Estimated image quality#
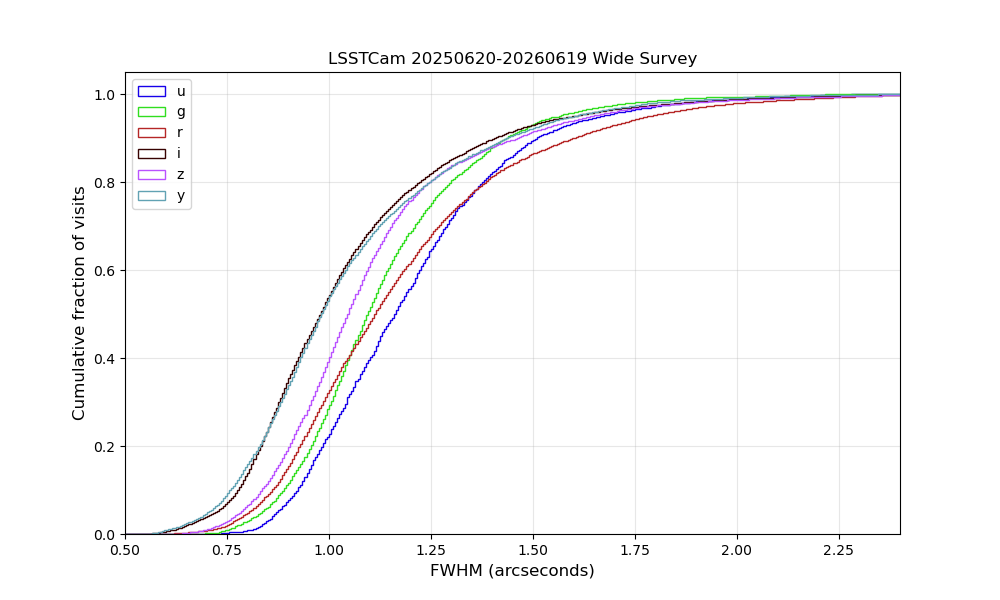
The distribution of estimated FWHM for Pre-LSST wide (SV and Pre-LSST) area.#
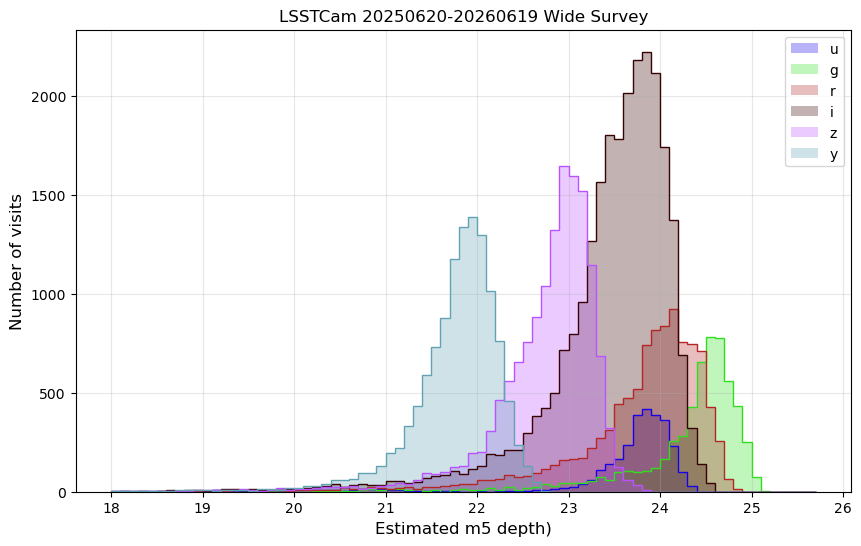
The distribution of estimated 5-sigma PSF magnitude limit for Pre-LSST wide (SV and Pre-LSST) area visits.#
The table below compares the delivered image quality over the period April 19, 2026 – June 19, 2026, to the predicted image quality over the same months of the year in our current baseline simulation, baseline_v5.3.0_10yrs.db. Note that these are the median values of all visit, and median value across the field of view and thus will not capture outliers.
band |
median airmass |
median fwhm (arcsec) |
mean cloud (mag) |
median m5 |
|---|---|---|---|---|
baseline u |
1.16 |
1.1 |
0 |
23.35 |
PreLSST u |
1.13 |
1.14 |
0.69 |
23.79 |
baseline g |
1.17 |
1.04 |
0 |
24.52 |
PreLSST g |
1.11 |
1 |
0.49 |
24.54 |
baseline r |
1.18 |
0.98 |
0 |
23.98 |
PreLSST r |
1.14 |
1.02 |
0.46 |
24 |
baseline i |
1.2 |
0.92 |
0 |
23.51 |
PreLSST i |
1.11 |
0.96 |
0.38 |
23.52 |
baseline z |
1.21 |
0.9 |
0 |
22.96 |
PreLSST z |
1.15 |
0.99 |
0.39 |
22.84 |
baseline y |
1.25 |
0.91 |
0 |
21.98 |
PreLSST y |
1.13 |
0.92 |
0.24 |
21.83 |
The FWHM and point-source 5-sigma limiting magnitude values above come from the
real-time Rapid Analysis QuickLook processing that occurs on the summit.
This processing provides real-time feedback for the AOS pipelines and other uses.
Different data management processing pipelines use different configurations and can
result in different values for FWHM or m5, due to many factors, including the selection
of input stars for calibration. The values coming from other pipelines, such as
Data Release Pipelines, will likely be similar, but should
be expected to show some differences,
particularly when evaluating a particular visit or detector.
Last Updated
Last Updated 2026/06/28