

Summary 20250930#
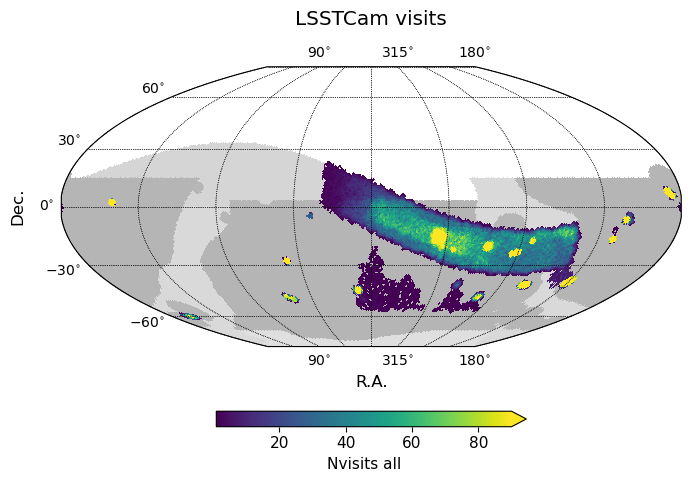
All science visits acquired during LSSTCam commissioning.#
The initial LSSTCam commissioning period has come to a close after the last night of SV data acquisition on 20250921.
Science images with LSSTCam began 20250417, at first acquiring small field survey visits dithered over small areas around a central boresight. These visits were generally acquired in sequences of at least 10 visits per bandpass, cycling through available bandpasses, in a manner similar to acquiring small field survey science visits during ComCam commissioning (which resulted in images available as part of DP1).
The Science Validation (SV) survey began on 20250620, acquiring visits in a manner consistent with the planned operations survey for the LSST, although with a much more limited area to facilitate gaining depth within the SV timeline. The SV survey consisted of a wide area following the ecliptic plane from dense regions of the Galactic Bulge through low-dust regions within the planned LSST Wide Fast Deep (WFD) footprint and included four of the planned LSST Deep Drilling Fields (DDFs). A secondary area within the low-dust WFD was included to provide targets when the primary or DDF fields were not available, with the intention of providing images to help boost early template generation in these higher-declination areas.
During this commissioning period, a total of 21647 science visits were acquired. This count is after excluding known bad visits (as of 20250930), but includes visits with a wide range of data quality, due to both cloud extinction and/or delivered IQ or engineering issues. Of these, 7194 were obtained in small field survey science mode, 908 specifically for DDFs, and 13240 for the primary wide SV area. The bulk of these visits were acquired between 20250417 and 20250724, due to a combination of weather and necessary engineering tests to improve delivered image quality.
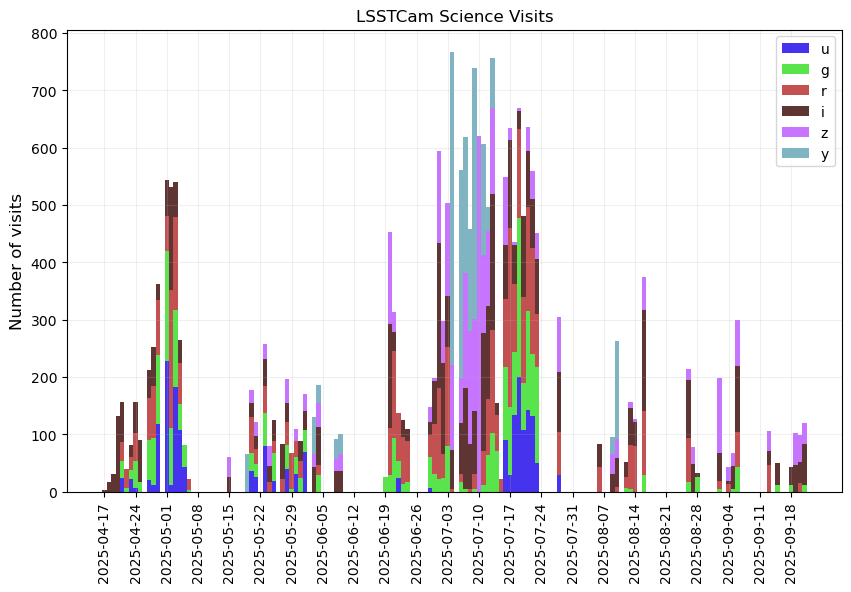
Timeline of science visit acquisition.#
Visit Database#
A database compiling the visits from the small field survey as well as the SV observations is available at
lsstcam_20250930.
Information contained in the database is based on entries in the Consolidated Database, including per-visit summary values from summit quicklook processing.
Additional columns have been added as part of post-processing from the rubin_nights package.
The database follows the current opsim schema, but adds the columns from the ConsDb and rubin_nights, as described in the links above.
Important
A tutorial notebook demonstrating how to query, load, and visualize the metadata in the lsstcam_20250930 database is available in the Rubin Science Platform at data.lsst.cloud, temporarily, until the Visit table for Data Preview 2 is released.
The small field survey science visits can be identified by field_survey_science in the observation_reason in the database
(and vice versa, SV visits can be identified by excluding field_survey_science).
Visits acquired as part of DDF sequences can be identified by ddf as part of the observation_reason.
In general, the observation_reason identifies the source of the visit within the FBS (which Survey object requested the visit), while the target_name identifies the region on the sky for the visit.
For the small field survey visits, the target_name was simply configured as the particular field target.
For SV visits, the target_name is configured as expected for the LSST, where DDF (or other particular targets) can
overlap other general wide areas of the survey such as the low_dust footprint area, so target_name will identify
both the DDF name as well as the underlying footprint areas.
Please note that some columns in this visit database contain NaNs, where the summit quicklook processing
did not have provide a useful value.
This can happen if processing was not fully successful on a particular visit, which could have many causes
ranging from missing calibration data (particularly near the start of commissioning), problems with the image
(such as PSF problems), excessive cloud extinction, issues with crowding, or computing resource issues.
Many of these problems will be resolved with later processing, including pipeline updates which are being developed
and tested in DRP commissioning.
Future updates are anticipated.
Running MAF metrics that use these NaN columns can be problematic at this time however.
Dropping the visits with NaN entries in the necessary columns avoids the propagation of these bad values,
and is likely the best answer at present - this can be done by adding a constraint such as fiveSigmaDepth is not NULL.
Small Field Survey Visits#
The small field survey visits, including the images which contributed toward Rubin First Look, covered the following targets:
u |
g |
r |
i |
z |
y |
all |
|
|---|---|---|---|---|---|---|---|
Carina |
22 |
16 |
23 |
63 |
— |
— |
124 |
Rubin_SV_280_-48 |
30 |
30 |
29 |
30 |
29 |
— |
148 |
ELAIS_S1 |
11 |
30 |
30 |
30 |
35 |
30 |
166 |
Rubin_SV_320_-15 |
— |
29 |
17 |
105 |
52 |
70 |
273 |
New_Horizons |
36 |
49 |
70 |
108 |
74 |
23 |
360 |
Rubin_SV_216_-17 |
— |
64 |
95 |
227 |
— |
— |
386 |
Rubin_SV_212_-7 |
— |
139 |
236 |
123 |
— |
— |
498 |
Prawn |
196 |
164 |
149 |
93 |
30 |
— |
632 |
COSMOS |
100 |
82 |
166 |
139 |
111 |
66 |
664 |
Trifid-Lagoon |
235 |
196 |
122 |
115 |
— |
— |
668 |
M49 |
261 |
280 |
378 |
254 |
— |
— |
1173 |
Rubin_SV_225_-40 |
312 |
568 |
441 |
387 |
240 |
104 |
2052 |
These images were generally acquired in sequences which cycled through each available bandpass, although with a variety of sequence lengths and dither patterns. However, because these images were acquired in these sequences where the atmospheric seeing contributions were relatively consistent during the sequence (on average), the image quality distribution is generally better in redder bands than in bluer bands. This effect also shows up in DDF visits in the SV survey, but for wide area visits it is muted as visits in different bandpasses sample different atmospheric conditions and the Feature Based Scheduler (FBS) chooses which bandpass to use in part based on the current seeing conditions.
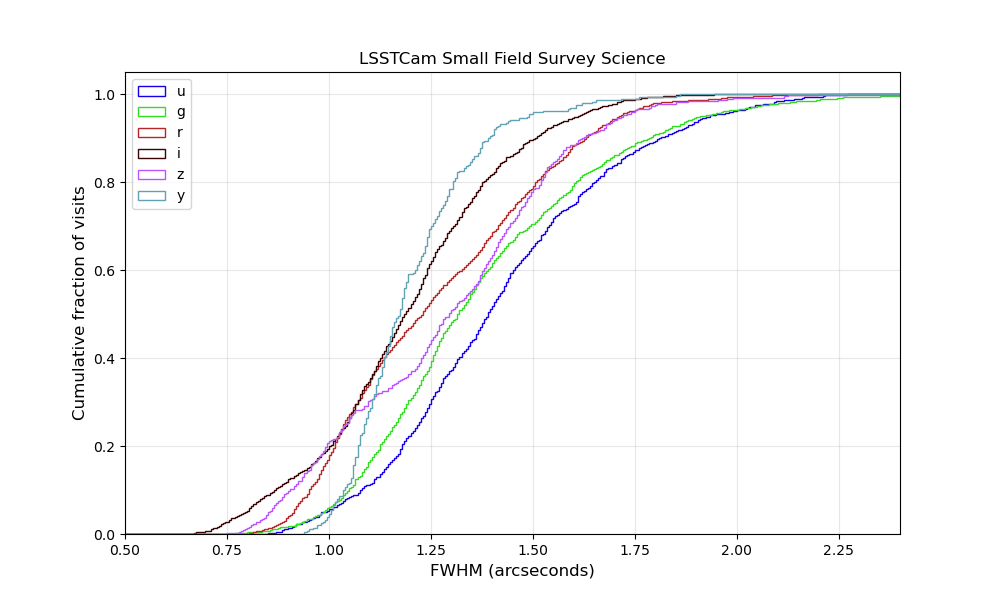
The table below shows the median FWHM for the visits for each small field survey target. These are the median values of the median value for each visit, so do not capture any potential issues with FWHM variations across the field of view. It also includes an estimate of the mean cloud extinction in the images. These are estimates based on the measured zeropoints for the images, compared to the expected zeropoint for an image in that bandpass at that airmass. A potential issue here is that visits with very heavy cloud extinction (or other problem with the quicklook image processing occuring immediately after image acquisition) may not succeed in measuring a zeropoint for the image at all, and thus no estimate for the cloud extinction will be possible either. Timespan indicates the number of nights between the first and last visit for the field.
nvisits |
median fwhm (arcsec) |
mean cloud (mag) |
timespan (days) |
|
|---|---|---|---|---|
Carina |
124 |
— |
— |
4 |
Rubin_SV_280_-48 |
148 |
1.52 |
0.08 |
1 |
ELAIS_S1 |
166 |
1.38 |
0.44 |
17 |
Rubin_SV_320_-15 |
273 |
1.22 |
0.03 |
6 |
New_Horizons |
360 |
1.05 |
0.2 |
62 |
Rubin_SV_216_-17 |
386 |
1.29 |
0.01 |
8 |
Rubin_SV_212_-7 |
498 |
1.21 |
0.05 |
7 |
Prawn |
632 |
1.37 |
0.07 |
79 |
COSMOS |
664 |
1.22 |
0.28 |
15 |
Trifid-Lagoon |
668 |
1.14 |
0.06 |
10 |
M49 |
1173 |
1.29 |
0.08 |
13 |
Rubin_SV_225_-40 |
2052 |
1.36 |
0.25 |
97 |
SV Survey Visits#
The SV survey includes visits from 20250620 to 20250921, with a total of 14453 visits acquired (after excluding known bad visits). Of these, 13240 were acquired for the wide area, while 908 were acquired for DDF visits. This is approximately 6% visits for DDF, which is consistent with expectations for the operations LSST. There were 194 visits acquired for Target of Opportunity (ToO) testing purposes, or approximately 1.3% of the total SV visits. The remaining visits were located in the “backup” area configured to provide future-template building targets when the primary area or DDFs were unavailable due to requirements to avoid the moon or azimuth constraints near dawn.
SV Wide#
The initial SV wide area was approximately 3000 square degrees; this was reduced to 750 square degrees approximately halfway through the SV survey period (see 2025-08-18 for more information). This was further reduced to approximately 300 square degrees during the last week or so of the SV period, to better enable difference image tests (see 2025-09-20 for more information). The median numbers of visits and coadded depths reported below are based medians within each of these subsets of wide SV area.
u |
g |
r |
i |
z |
y |
all |
|
|---|---|---|---|---|---|---|---|
(‘3k’, ‘Nvisits’) |
2 |
4 |
7 |
8 |
7 |
5 |
38 |
(‘3k’, ‘CoaddM5’) |
24.2 |
25 |
24.9 |
24.5 |
23.8 |
22.6 |
— |
(‘750’, ‘Nvisits’) |
2 |
4 |
12 |
16 |
11 |
9 |
56 |
(‘750’, ‘CoaddM5’) |
24.4 |
25.2 |
25.2 |
24.8 |
24 |
23 |
— |
(‘300’, ‘Nvisits’) |
2 |
5 |
11 |
18 |
15 |
10 |
64 |
(‘300’, ‘CoaddM5’) |
24.5 |
25.2 |
25 |
24.9 |
24.1 |
23 |
— |
The image quality was an issue during the SV observations. This is revealed in part as a PSF larger than expected, given estimates of the atmospheric contribution, but also in variations in the PSF across the field of view. In general, the median-per-visit PSF reported for the SV images is not excessively larger than the typical values expected at this time of year, but the shape and variability of the PSF is likely to be below full survey expectations.
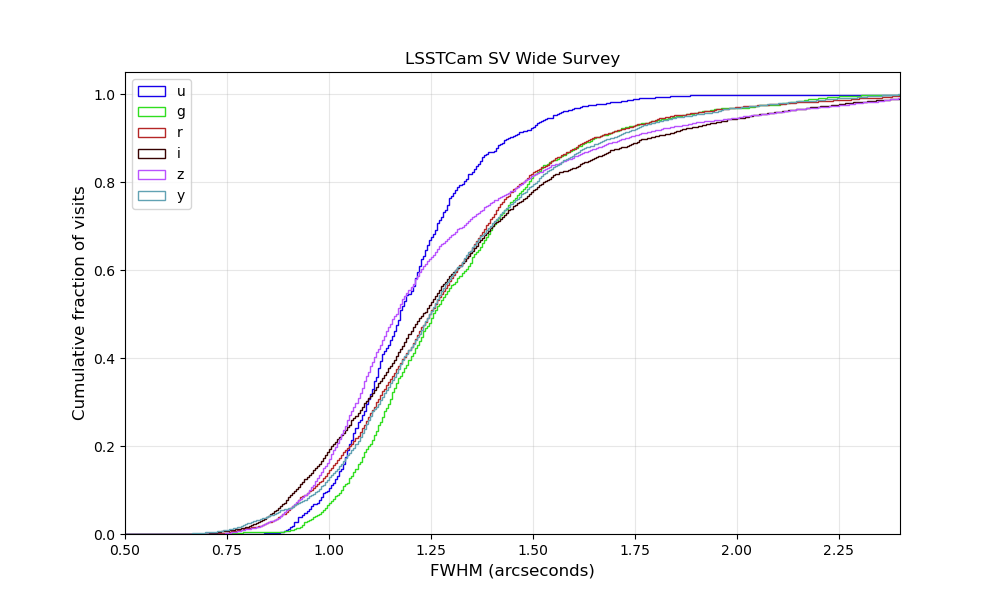
SV delivered image quality per visit, for visits within the Wide SV area.#
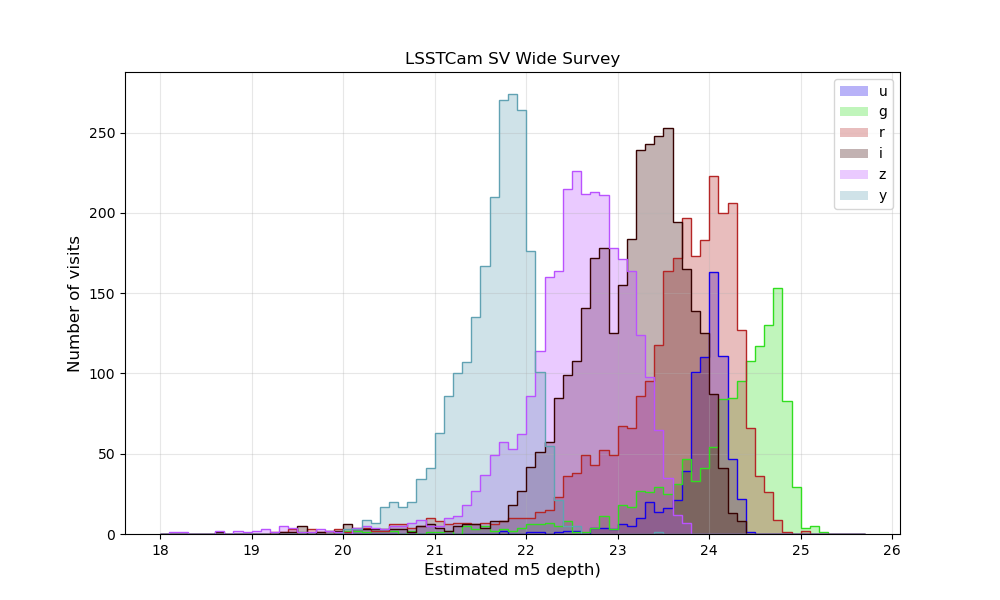
SV estimated individual image depth per visit, for visits within the Wide SV area.#
The individual image depth throughout the SV wide area is slightly shallower than the depth expected from baseline survey simulations (which consider the entire survey footprint and the entire 10 years of operations). This can be attributed to slightly worse delivered image quality and slightly higher mean cloud extinction. In good conditions, the measured median zero points for individual images were consistent with zeropoints predicted from the throughput curves from syseng_throughputs, suggesting that the overall system sensitivity is generally as expected.
median airmass |
median fwhm (arcsec) |
mean cloud (mag) |
median m5 |
|
|---|---|---|---|---|
baseline u |
1.21 |
1.25 |
0 |
23.34 |
SV u |
1.14 |
1.18 |
0.18 |
23.99 |
baseline g |
1.23 |
1.15 |
0 |
24.44 |
SV g |
1.22 |
1.26 |
0.26 |
24.37 |
baseline r |
1.22 |
1.08 |
0 |
24.03 |
SV r |
1.24 |
1.26 |
0.33 |
23.76 |
baseline i |
1.22 |
1.03 |
0 |
23.50 |
SV i |
1.24 |
1.24 |
0.23 |
23.25 |
baseline z |
1.22 |
1.02 |
0 |
22.94 |
SV z |
1.24 |
1.17 |
0.17 |
22.63 |
baseline y |
1.22 |
1.02 |
0 |
22.00 |
SV y |
1.25 |
1.25 |
0.08 |
21.72 |
SV DDFs#
Within the SV survey, the DDFs had variable completeness. The timing of the SV survey was relatively early in the observing season for any of the DDFs, and COSMOS was completely unavailable. The other DDFs became observable near the tail end of the night starting in July, with ELAISS1 rising first. As such, ELAISS1 received the most visits, but the other DDFs were difficult to observe given the limited SV time on-sky. Only ELAISS1 received visits in all of ugrizy. Most of the other DDFs were observed in griz, which were the only bandpasses available after 20250810. The XMM-LSS field never received visits in any band other than u; there were some complications due to the compressed observing cadence (and resulting heightened competition between DDFs), the azimuth constraints at the end of the night, the patchiness of SV observing time, and this field also became unavailable at times due to moon avoidance.
The dither pattern used for the DDFs evolved over time. Initially, the dithers were quite small and were not dithered within a night. Scattered light proved to be a problem for these fields, and the lack of dithers within a night became a problem in terms of building template images. In later observations, dithers within a night (both translational and rotational) were adopted; dithers from night to night continued. The optimal DDF dither pattern for LSST is the subject of ongoing investigations, but will likely involve dithers within the night as well as between nights.
u |
g |
r |
i |
z |
y |
all |
|
|---|---|---|---|---|---|---|---|
ddf_xmm_lss |
30 |
— |
— |
— |
— |
— |
30 |
ddf_edfs_a |
— |
20 |
21 |
28 |
18 |
— |
87 |
ddf_edfs_b |
— |
24 |
21 |
29 |
18 |
— |
92 |
ddf_ecdfs |
— |
36 |
39 |
41 |
44 |
— |
160 |
ddf_elaiss1 |
39 |
101 |
103 |
168 |
112 |
16 |
539 |
nvisits |
median fwhm (arcsec) |
mean cloud (mag) |
timespan (days) |
|
|---|---|---|---|---|
ddf_xmm_lss |
30 |
1.47 |
0.07 |
10 |
ddf_edfs_a |
87 |
1.32 |
0.16 |
55 |
ddf_edfs_b |
92 |
1.37 |
0.13 |
55 |
ddf_ecdfs |
160 |
1.51 |
0.17 |
57 |
ddf_elaiss1 |
539 |
1.4 |
0.1 |
84 |
SV Combined#
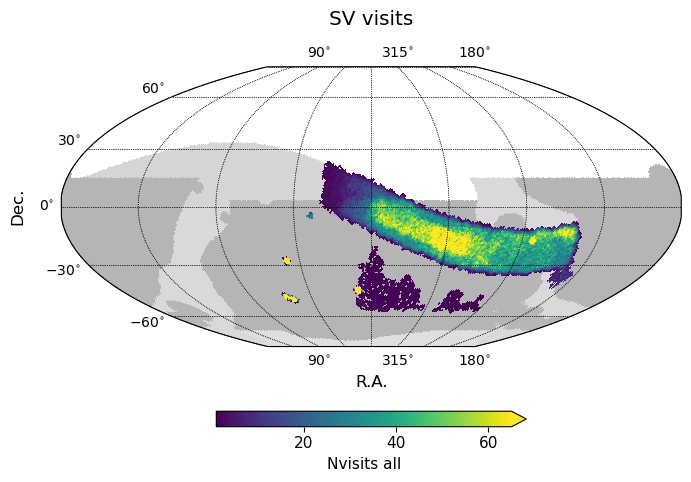
Number of SV survey visits, all bands.#
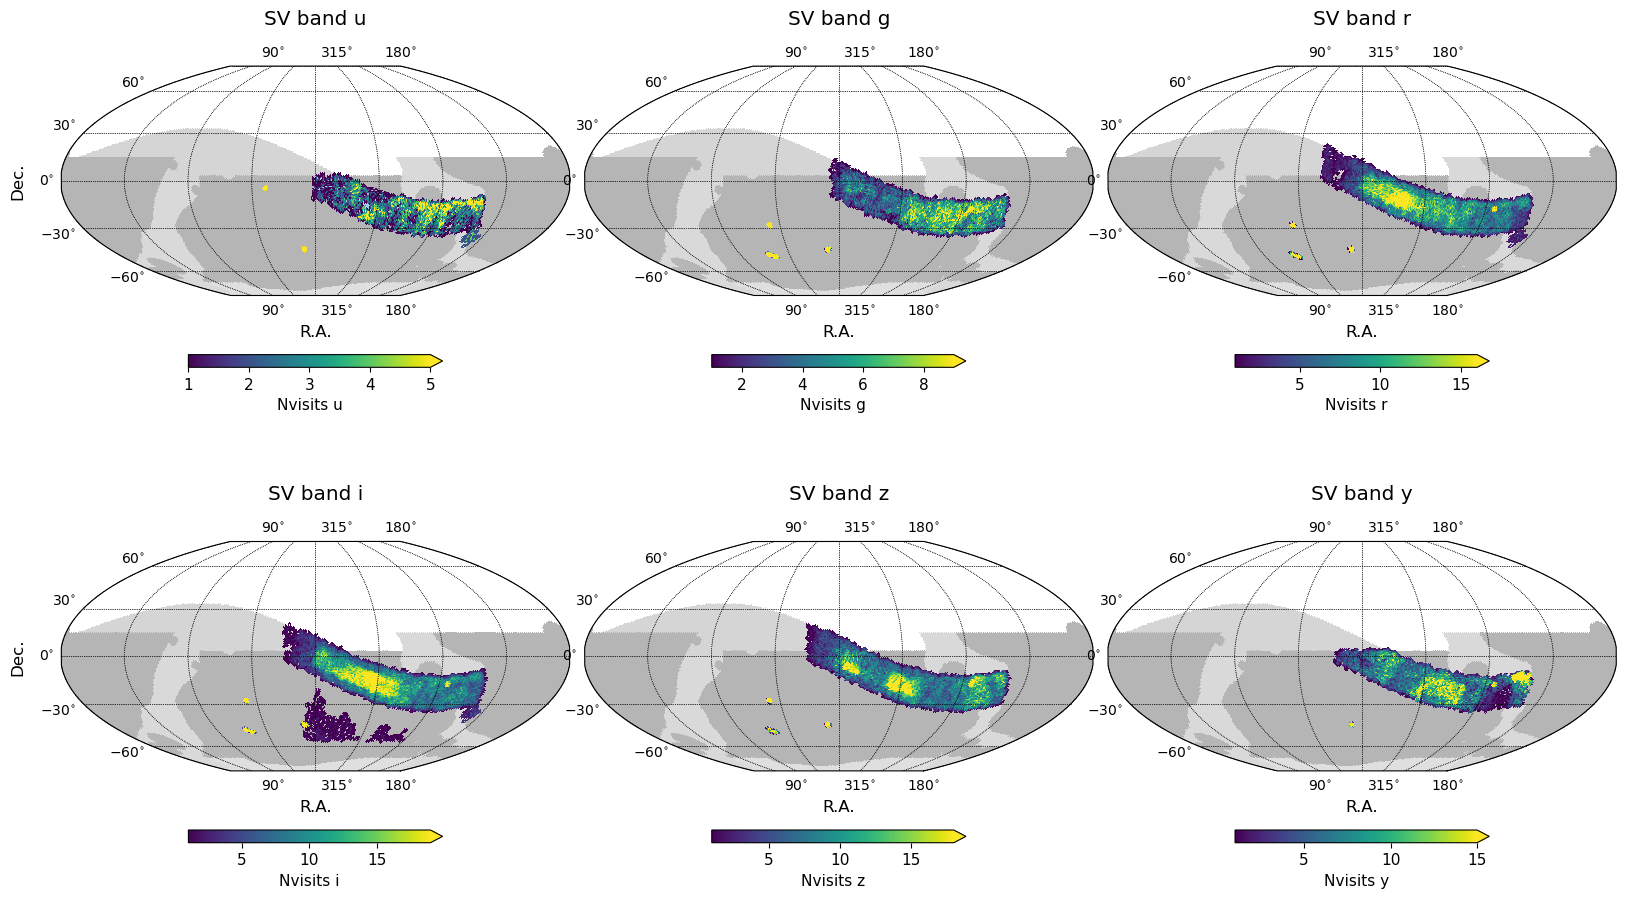
Number of SV survey visits, per band.#
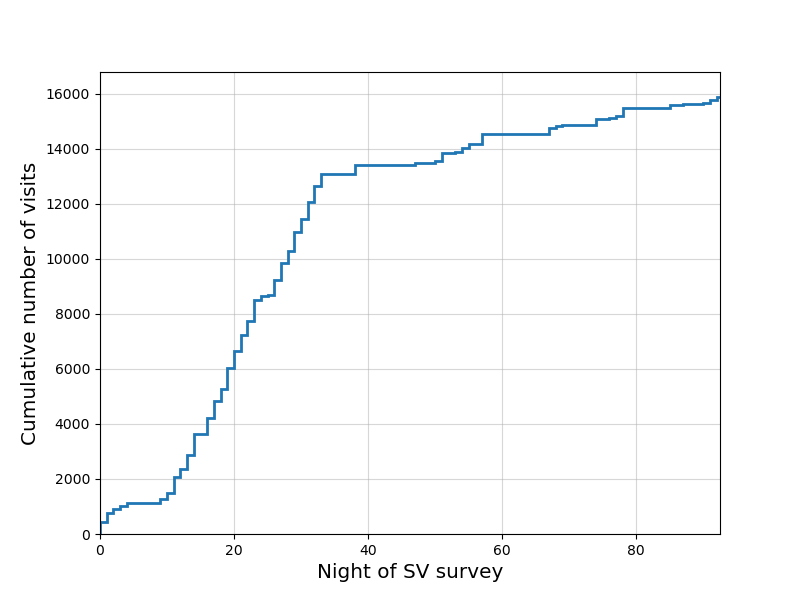
Cumulative visit acquisition over time for the SV survey.#
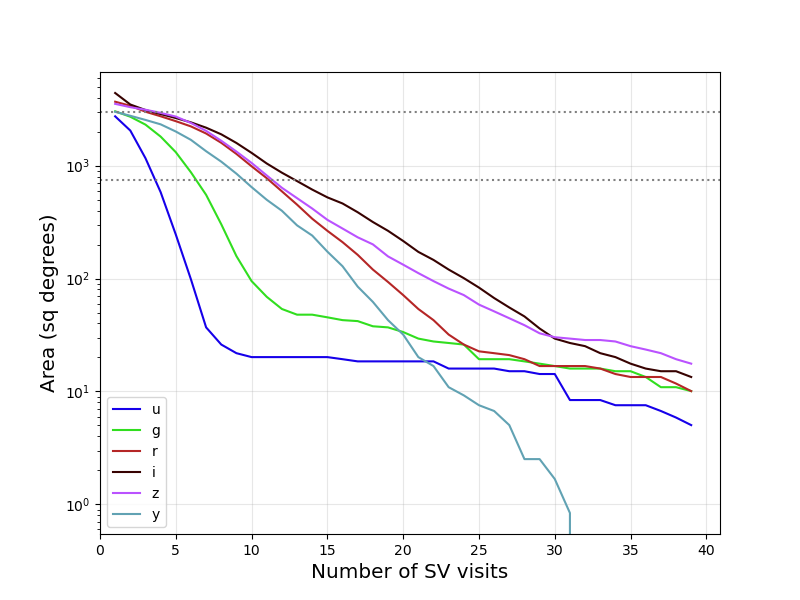
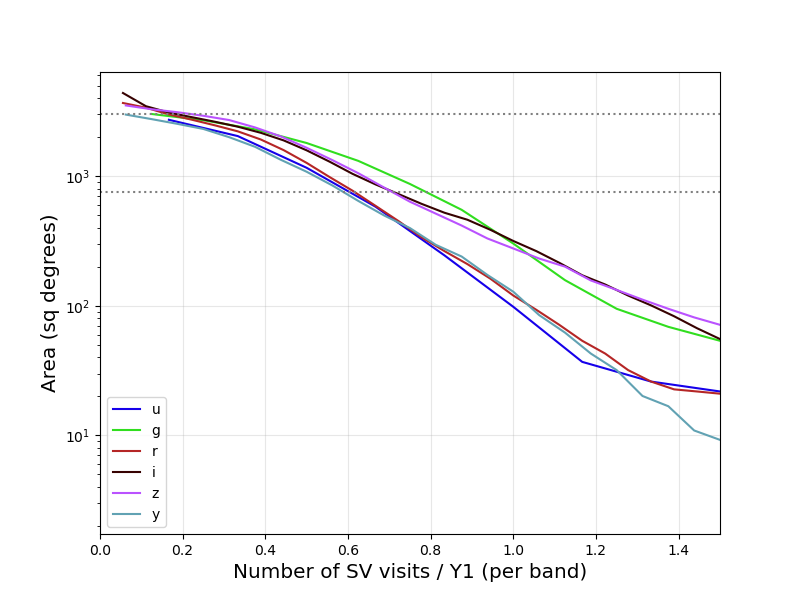
The amount of area observed with the equivalent of one year WFD number of visits in each of giz band was around 300 sq degrees. Over 1000 sq degrees received at least the equivalent of half the integrated exposure time of one year of LSST WFD.
Last Updated
Last Updated 2025/11/25